
Roughly 7 out of 10 online shopping carts never turn into a paid order. Baymard Institute puts the average documented cart abandonment rate at 70.22% across 50 studies from 2006 to 2025. The good news for any store owner reading this: most of that loss is not about price or product, it is about checkout UX, and a large share of it is fixable. This guide walks through why shoppers quit at checkout and gives you a practical checklist to win some of those orders back.
What cart abandonment really costs your store
Abandonment is not a rounding error, it is the single biggest leak in most ecommerce funnels. Baymard documents a range of 55% to 84% depending on the study, with a plain average of 70.22%. When you strip out the people who were “just browsing and not ready to buy,” the shoppers who genuinely wanted to buy but walked away are telling you something about your flow.
Here is the figure that should get a business owner’s attention. Baymard estimates that fixing the checkout usability issues it has documented could lift conversion for the average large store by 35.26%, which it translates into roughly 260 billion USD of recoverable orders across the US and EU alone. You are not a billion dollar store, but the same percentage applies to your numbers. A shop doing 200 million VND a month in revenue is leaving real money on the table every single day the checkout stays broken.
The local stakes are rising too. Vietnam’s ecommerce market reached 38.5 billion USD in 2025, up 21%, and first half 2026 revenue hit 291.6 trillion VND, a 44.1% jump year on year, with around 60% of the population now shopping online. More buyers means more carts, and a leaky checkout scales that leak right along with your traffic.
Why shoppers abandon checkout
When Baymard asked buyers why they left, the reasons cluster into a few clear groups. Here they are, in order, for shoppers who had real intent to purchase.
Cost surprises are the number one killer. 40% abandoned because extra costs (shipping, tax, fees) were too high, and 12% left because they could not see or calculate the total order cost upfront. Added together, hidden and late revealed costs are the dominant reason people quit.
Trust gaps come next. 19% did not trust the site with their credit card information. For a small brand without a household name, every trust signal you remove is a shopper you lose.
Forced friction drives people away. 18% abandoned because the site made them create an account, and 17% left because the checkout was too long or complicated. These are entirely self inflicted wounds.
Technical failure ends the session. 17% hit a site that had errors or crashed, 10% had a card declined, and 9% did not find enough payment methods.
The pattern is clear. Shoppers do not abandon because they changed their mind about your product. They abandon because the path to pay you felt expensive, risky, slow, or unreliable. Every one of those four is a design decision you control.
The checkout friction audit: a 10 point checklist
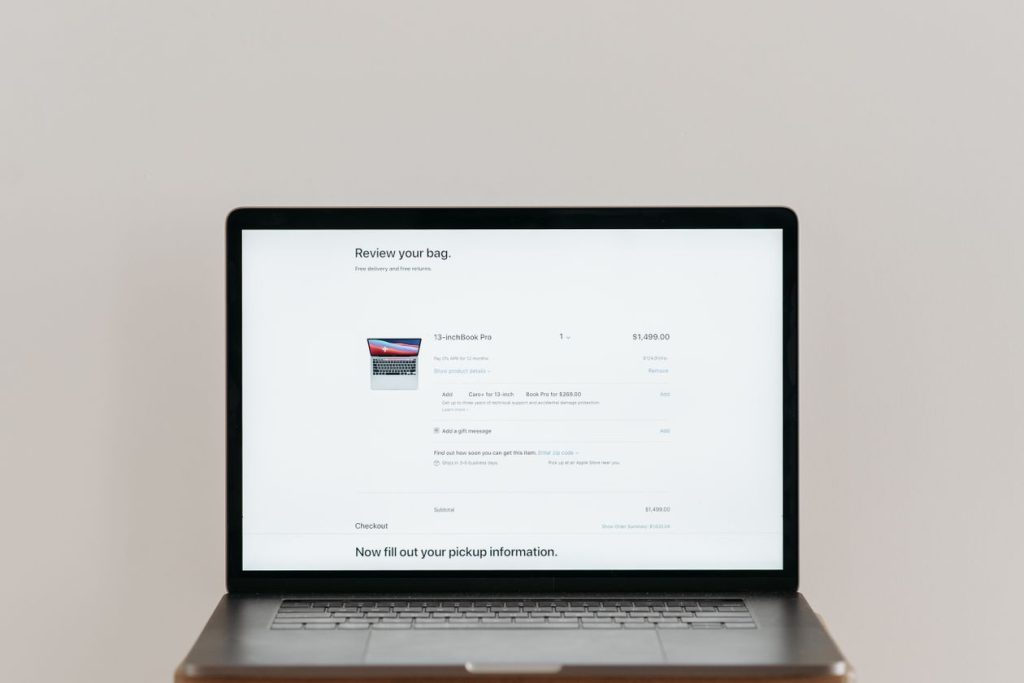
Baymard found that the typical US checkout shows 23.48 form elements by default (14.88 if you count only real input fields), while an ideal flow needs just 12 to 14 elements (7 to 8 fields). Most stores can cut 20% to 60% of their checkout fields without losing anything they actually need. Run your own checkout against this list.
1. Show the full price early. Display shipping, tax, and fees before the final step. No late surprises.
2. Offer guest checkout, and make it obvious. Let people buy without an account. Baymard found that saving the account invitation until after the purchase performed better than pushing it before or during checkout.
3. Cut every field you do not need. If you will not use it to fulfil or contact, delete it. Aim for 7 to 8 real input fields.
4. Mark required and optional fields clearly. 32% of test participants failed to complete a required field when only the optional ones were marked.
5. Explain why you ask for sensitive data. 68% of shoppers are reluctant to give a phone number at checkout. Tell them it is for delivery updates, or make it optional.
6. Use the right input type. A number pad for phone, autofill for address, a clear date for delivery. Wrong input types are a top cause of field errors.
7. Keep it to as few steps as possible. Collapse completed steps into editable summaries so buyers always know where they are.
8. Support the payment methods your buyers actually use. Missing a preferred method sends 9% of shoppers away.
9. Build visible trust at the payment step. Security badges, a clear return policy, and real contact details reduce the 19% who do not trust you with their card.
10. Test checkout on a real phone. Most Vietnamese shoppers buy on mobile, and mobile checkout UX is where the worst friction usually hides.
A decision framework: fix now, test, or leave it
Not every checkout change deserves the same priority. Baymard’s benchmark of leading sites found an average of 39 potential improvement areas per checkout, so you need a way to triage. Use this simple frame.
| Change | Effort | Expected impact | Verdict |
|---|---|---|---|
| Show full costs before final step | Low | High | Fix now |
| Add guest checkout | Low to medium | High | Fix now |
| Remove unused form fields | Low | Medium to high | Fix now |
| Add trust badges and return policy at payment | Low | Medium | Fix now |
| Add a new payment method | Medium | Medium | Test demand first |
| Rebuild into one step checkout | High | Varies | Test, do not assume |
| Add address autocomplete | Medium | Medium | Nice to have |
The rule of thumb: anything that removes a cost surprise, a forced account, or an unnecessary field is almost always worth doing immediately, because it fixes a documented top reason for abandonment at low cost. Bigger structural changes should be tested against your own data, not copied from a competitor.
Checkout UX for Vietnamese online stores
Global best practice needs a local layer. In Vietnam, cash on delivery is still a trust anchor for many first time buyers, so offering it alongside bank transfer, e wallets, and card gives nervous shoppers a safe default. Zalo and phone contact matter more here than a generic contact form, so make them visible at the payment step. And because so much buying happens on mobile and often inside social apps, your checkout has to survive a small screen, a slow connection, and a thumb. If a buyer has to pinch, zoom, or hunt for the pay button, you have already lost a share of them.
If you are not sure where your own checkout leaks, that is exactly the kind of audit our team runs. You can see how we approach website and conversion work on our services page.
Frequently asked questions
What is a good cart abandonment rate?
There is no single “good” number, but Baymard’s documented average is 70.22%, with a range of 55% to 84%. If your store sits well above 70%, your checkout UX is almost certainly costing you orders you could recover.
Does forcing account creation really lose sales?
Yes. 18% of shoppers abandon specifically because a site makes them create an account. Offer guest checkout, and save the account invitation for after the purchase is done.
Will a shorter checkout actually increase conversion?
Reducing friction removes documented reasons for abandonment, so it usually helps. The safest path is to cut obvious waste (hidden costs, forced accounts, unused fields) right away, then test larger structural changes against your own sales data before committing.
Ready to plug the leak in your checkout?
A checkout audit is one of the fastest ways to turn traffic you already pay for into orders. If you want us to review your store’s checkout flow and show you where buyers drop off, call Webie Vietnam at +84 969 838 467 or email huyen.dang@webie.com.vn for a free consultation.